 Daily Globe British Values, Global Perspective
Related Articles


The Remain campaign, both before and after the referendum, have long argued that being part of the European Union’s Single Market and Custom’s Union benefits our non-EU trade. They argue that we benefit from the “clout” of being part of a large bloc, that goes around the world negotiating multiple trade deals on our behalf. We are told that the United Kingdom would never be able to do this on its own, and if it tried, it wouldn’t be as successful.
Does this claim have any merit? In order to answer this question, I have analysed data from the World Trade Organisation (WTO), and compared the EU’s performance in conducting Free Trade Agreements (FTAs) around the world with several other countries: namely Switzerland, Australia, Peru, Singapore, South Korea. These countries are all smaller than the UK, manage to run their own trade negotiations, and are from different continents to try and give a global outlook. Only trade deals listed at the WTO as “Free Trade Agreements” or “Economic Integration Agreements” have been used – agreements defined as “Partial Scope Agreements” by the WTO have been ignored. GDP Data is 2018 data in current US dollars from the World Bank. Where GDP data for countries is not available from the World Bank (small countries or countries not reporting data), then the most recent available year has been used, and from other sources if necessary (see data appendix).
So how do these relatively small analogue countries compare to the behemoth that is the European Union?
Firstly, it is claimed that the EU is the most prolific free-trading bloc on the planet. Looking at the total number of FTAs signed, it is clear that the EU has signed more than any of the selected analogue countries:
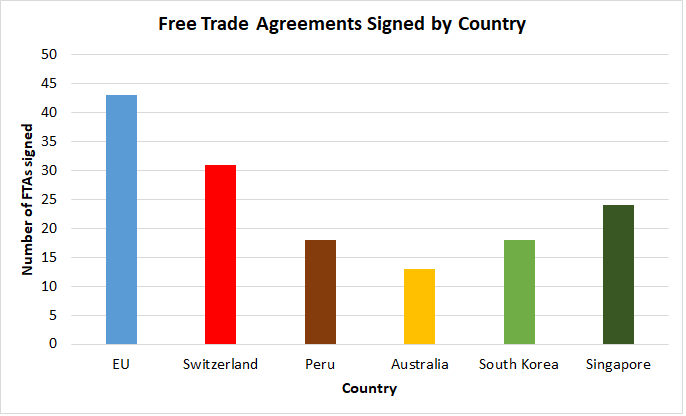
The number of Free Trade Agreements signed by EU and a selection of different countries around the world. Source: http://rtais.wto.org/UI/publicPreDefRepByCountry.aspx
The EU has signed 43 Free Trade Agreements, which is not only more than any of the countries compared above, but also more than any other WTO member.
However, it is not only the sheer number of agreements that are signed which is important, but also the size and value of the markets to which preferential access is gained. In short, a Free Trade Agreement with the United States is far more valuable than one with the Wallis & Futuna Islands.
Summing the GDP of countries with which the EU has made an FTA reveals the value of the market which the FTAs have opened up. Doing the same with the selected analogue countries reveals a wholly different picture:

The market size (measured in GDP) opened up by the EU and a selection of other countries via Free Trade Agreements. The data item “EU” represents the FTAs signed between the EU and non-EU countries. “EU inc. EU” includes the GDP of EU member states to this total. GDP data is current US$ and is sourced from the World Bank.
The data is striking. It is immediately apparent that the EU as a whole has vastly under-performed with regards to agreeing FTAs with countries outside of its own borders – only opening up markets worth $13.7 trillion. Adding the GDP of the EU’s constituent countries (with which the EU has ensured frictionless trade) gives the “EU inc. EU” figure of $33.3 trillion – still lower than any of the analogue countries, and distinctly average in the WTO.
Meanwhile, the other countries have done far better. Peru has opened up markets worth $65.3 trillion, Switzerland $46.9 trillion, Singapore $52.5 trillion, South Korea $64.7 trillion and Australia $47.3 trillion. All have been remarkably successful at agreeing FTAs, easily outperforming the EU, despite the fact that they are all relatively small nations.
By plotting when these markets were opened up over time, it is possible to see when enhanced market access was achieved:

The market size enjoyed preferential access via FTAs, by country, over time. GDP data used are all 2018 values, irrespective of where they appear on the graph, and are in current US$. FTA data is from the WTO website. GDP data is from the World Bank.
The graph shows the “EU inc. EU” registering the first agreement, which was the formation of the EEC in 1957. Switzerland also registers during this early period, with the formation of EFTA in 1960.
The EU continued to enlarge throughout the 70s, 80s and the early to mid 2000s, and this is reflected in the slow upward trend of the “EU inc. EU” line. The “EU” line however, which only accounts for EU FTAs done with nations outside its own borders, shows how poorly the EU has performed compared to other countries around the world. Whilst the other analogue nations have been able to achieve multiple FTAs with large G20 nations, the EU has struggled.
The EU’s under-performance is summed up by the following: At the time of the 2016 referendum, the EU had only signed FTAs with two of the world’s 10 largest non-EU economies (IMF, 2019). Today, the EU has only managed to secure an FTA with only four of them, namely: Japan, Canada, South Korea and Mexico. Meanwhile, Peru has in place seven FTAs with the world’s top 10 non-EU economies. Singapore has secured six, whilst Switzerland, South Korea and Australia have secured five.
The data suggests that instead of boosting the UK on the world stage, the EU has held it back. The fact that even relatively small countries from Asia and South America can outperform the EU when it comes to negotiating Free Trade Agreements reveals the EU’s supposed superiority as a myth. The EU’s huge size is not an advantage, as Remainers would claim, but has simply led to the EU being unable to ratify agreements with others, in a global arena where agility and flexibility is important.
With the UK already signing multiple continuity Free Trade Agreements in anticipation of leaving the EU, it is clear that the best strategy with regards to international trade is to leave the EU’s Customs Union and Single Market, and take back full control of our International trade policy.
Appendix
These tables show the raw data used to create the graphs used in the main article.
| EU | 43 RTAs | |||
| YEAR | SIGNATORIES | GDP | GDP data yr (if not 2018) | Source |
| 1957 | Belgium | 5.31767E+11 | ||
| France | 2.77754E+12 | |||
| Germany | 3.99676E+12 | |||
| Italy | 2.0739E+12 | |||
| Luxembourg | 69487922619 | |||
| Netherlands | 9.12872E+11 | |||
| 1971 | French Polynesia | 3,448,000,000 | YR2000 | World bank |
| French Southern Territories | 0 | |||
| Netherlands Antilles | 3810000000 | YR2007 | wiki | |
| New Caledonia | 9900000000 | YR2009 | tradingeconomics | |
| Saint Pierre and Miquelon | 253000000 | YR2013 | wiki | |
| Wallis & Futuna islands | 188000000 | YR2005 | wiki | |
| 1973 | Iceland | 25878475760 | ||
| 1973 | Norway | 4.34751E+11 | ||
| 1973 | Switzerland | 7.05501E+11 | ||
| Liechtenstein | 6210000000 | YR2016 | tradingeconomics | |
| 1973 | Denmark | 3.513E+11 | ||
| Ireland | 3.75903E+11 | |||
| United Kingdom | 2.82521E+12 | |||
| 1977 | Syria | 73670000000 | YR2012 | tradingeconomics |
| 1981 | Greece | 2.18032E+11 | ||
| 1986 | Portugal | 2.37979E+11 | ||
| Spain | 1.42619E+12 | |||
| 1991 | Andorra | 3236543909 | ||
| 1995 | Austria | 4.55737E+11 | ||
| Finland | 2.75683E+11 | |||
| Sweden | 5.51032E+11 | |||
| 1996 | Turkey | 7.66509E+11 | ||
| 1997 | Faroe Islands | 2689000000 | YR2016 | world bank |
| 1997 | Palestine | 14500000000 | YR2017 | tradingeconomics |
| 1998 | Tunisia | 39860715814 | ||
| 2000 | Israel | 3.6969E+11 | ||
| 2000 | Mexico | 1.22381E+12 | ||
| 2000 | Morocco | 1.18495E+11 | ||
| 2000 | South Africa | 3.66298E+11 | ||
| 2001 | North Macedonia | 12672131053 | ||
| 2002 | Jordan | 42290832158 | ||
| 2002 | San Marino | 1659000000 | YR2017 | world bank |
| 2003 | Chile | 2.98231E+11 | ||
| 2003 | Lebanon | 56639155556 | ||
| 2004 | Egypt | 2.50895E+11 | ||
| 2004 | Cyprus | 24469841832 | ||
| Czech Republic | 2.44105E+11 | |||
| Estonia | 30284890757 | |||
| Hungary | 1.55703E+11 | |||
| Latvia | 34849078086 | |||
| Lithuania | 53251369047 | |||
| Malta | 14542039605 | |||
| Poland | 5.85783E+11 | |||
| Slovakia | 1.06472E+11 | |||
| Slovenia | 54235484383 | |||
| 2005 | Algeria | 1.80689E+11 | ||
| 2006 | Albania | 15058879129 | ||
| 2007 | Bulgaria | 65132951116 | ||
| Romania | 2.39553E+11 | |||
| 2008 | Antigua and Barbuda | 1623804016 | ||
| Bahamas | 12160000000 | YR2017 | world bank | |
| Barbados | 4797000000 | YR2017 | world bank | |
| Belize | 1925000000 | |||
| Dominica | 503646211.1 | |||
| Dominican Republic | 81298585403 | |||
| Grenada | 1207454556 | |||
| Guyana | 3610435299 | |||
| Jamaica | 15717858487 | |||
| St Kitts & Nevis | 1039875050 | |||
| St Lucia | 1876189778 | |||
| St Vincent & the Grenadines | 813093984.1 | |||
| Suriname | 3427269682 | |||
| Trinidad & Tobago | 23410353435 | |||
| 2008 | Montenegro | 5452173041 | ||
| 2009 | Papua New Guinea | 23431596214 | ||
| Fiji | 5479504926 | |||
| 2010 | Serbia | 50508366850 | ||
| 2011 | Rep of Korea | 1.61942E+12 | ||
| 2012 | Madagascar | 12100459087 | ||
| Mauritius | 14220348673 | |||
| Seychelles | 1590180446 | |||
| Zimbabwe | 31000519447 | |||
| 2013 | Croatia | 60805659436 | ||
| 2013 | Costa Rica | 60126014829 | ||
| El Salvador | 26056950000 | |||
| Guatemala | 78460447920 | |||
| Honduras | 23803230473 | |||
| Nicaragua | 13117859222 | |||
| Panama | 65055100000 | |||
| 2013 | Colombia | 3.30228E+11 | ||
| Peru | 2.22238E+11 | |||
| 2014 | Cameroon | 38502059858 | ||
| 2014 | Georgia | 16209818081 | ||
| 2014 | Moldova | 11309082555 | ||
| 2014 | Ukraine | 1.30832E+11 | ||
| 2015 | Bosnia & Herzegovina | 19781776101 | ||
| 2016 | Cote D’Ivoire | 43007045466 | ||
| 2016 | Ghana | 65556464056 | ||
| 2016 | Botswana | 18616018903 | ||
| Eswatini | 4703787507 | |||
| Lesotho | 2791762880 | |||
| Mozambique | 14457964381 | |||
| Namibia | 14521711630 | |||
| 2017 | Canada | 1.70933E+12 | ||
| 2018 | Armenia | 12433089919 | ||
| 2019 | Japan | 4.97092E+12 |
| SWITZERLAND | 31 RTAs | |||
| YEAR | SIGNATORIES | GDP | GDP data yr (if not 2018) | Source |
| 1960 | Austria | 4.56E+11 | ||
| Denmark | 3.51E+11 | |||
| Norway | 4.35E+11 | |||
| Portugal | 2.38E+11 | |||
| Sweden | 5.51E+11 | |||
| United Kingdom | 2.83E+12 | |||
| 1970 | Iceland | 2.59E+10 | ||
| 1973 | Belgium | 5.32E+11 | ||
| France | 2.78E+12 | |||
| Germany | 4E+12 | |||
| Italy | 2.07E+12 | |||
| Luxembourg | 6.95E+10 | |||
| Netherlands | 9.13E+11 | |||
| Ireland | 3.76E+11 | |||
| 1981 | Greece | 2.18E+11 | ||
| 1986 | Portugal | 2.38E+11 | ||
| Spain | 1.43E+12 | |||
| 1991 | Andorra | 3.24E+09 | ||
| 1992 | Turkey | 7.67E+11 | ||
| 1993 | Israel | 3.7E+11 | ||
| 1995 | Faroe Islands | 2.69E+09 | YR2016 | world bank |
| 1995 | Finland | 2.76E+11 | ||
| 1999 | Morocco | 1.18E+11 | ||
| 1999 | Palestine | 1.45E+10 | YR2017 | tradingeconomics |
| 2001 | Mexico | 1.22E+12 | ||
| 2002 | Jordan | 4.23E+10 | ||
| 2002 | North Macedonia | 1.27E+10 | ||
| 2003 | Singapore | 3.64E+11 | ||
| 2004 | Chile | 2.98E+11 | ||
| 2004 | Cyprus | 2.45E+10 | ||
| Czech Republic | 2.44E+11 | |||
| Estonia | 3.03E+10 | |||
| Hungary | 1.56E+11 | |||
| Latvia | 3.48E+10 | |||
| Lithuania | 5.33E+10 | |||
| Malta | 1.45E+10 | |||
| Poland | 5.86E+11 | |||
| Slovakia | 1.06E+11 | |||
| Slovenia | 5.42E+10 | |||
| 2005 | Tunisia | 3.99E+10 | ||
| 2006 | Rep of Korea | 1.62E+12 | ||
| 2007 | Egypt | 2.51E+11 | ||
| 2007 | Lebanon | 5.66E+10 | ||
| 2007 | Bulgaria | 6.51E+10 | ||
| Romania | 2.4E+11 | |||
| 2008 | Botswana | 1.86E+10 | ||
| Lesotho | 2.79E+09 | |||
| Namibia | 1.45E+10 | |||
| South Africa | 3.66E+11 | |||
| Eswatini | 4.7E+09 | |||
| 2009 | Japan | 4.97E+12 | ||
| 2009 | Canada | 1.71E+12 | ||
| 2010 | Albania | 1.51E+10 | ||
| 2010 | Serbia | 5.05E+10 | ||
| 2011 | Colombia | 3.3E+11 | ||
| 2011 | Peru | 2.22E+11 | ||
| 2012 | Hong Kong | 3.63E+11 | ||
| 2012 | Montenegro | 5.45E+09 | ||
| 2012 | Ukraine | 1.31E+11 | ||
| 2014 | Costa Rica | 6.01E+10 | ||
| Panama | 6.51E+10 | |||
| 2014 | China | 1.36E+13 | ||
| 2015 | Bosnia & Herzegovina | 1.98E+10 | ||
| 2017 | Georgia | 1.62E+10 | ||
| 2018 | Philippines | 3.31E+11 | ||
| PERU | 18 RTAs | |||
| YEAR | SIGNATORIES | GDP | GDP data yr (if not 2018) | Source |
| 1988 | Bolivia | 4.029E+10 | ||
| Colombia | 3.302E+11 | |||
| Ecuador | 1.084E+11 | |||
| Venezuela | 4.824E+11 | YR2014 | world bank | |
| 2009 | United States | 2.049E+13 | ||
| 2009 | Chile | 2.982E+11 | ||
| 2009 | Canada | 1.709E+12 | ||
| 2009 | Singapore | 3.642E+11 | ||
| 2010 | China | 1.361E+13 | ||
| 2011 | Iceland | 2.588E+10 | ||
| Liechtenstein | 6.21E+09 | YR2016 | tradingeconomics | |
| Norway | 4.348E+11 | |||
| Switzerland | 7.055E+11 | |||
| 2011 | Rep of Korea | 1.619E+12 | ||
| 2012 | Mexico | 1.224E+12 | ||
| 2012 | Japan | 4.971E+12 | ||
| 2012 | Panama | 6.506E+10 | ||
| 2013 | Costa Rica | 6.013E+10 | ||
| 2013 | Austria | 4.557E+11 | ||
| Belgium | 5.318E+11 | |||
| Bulgaria | 6.513E+10 | |||
| Croatia | 6.081E+10 | |||
| Cyprus | 2.447E+10 | |||
| Czech Republic | 2.441E+11 | |||
| Denmark | 3.513E+11 | |||
| Estonia | 3.028E+10 | |||
| Finland | 2.757E+11 | |||
| France | 2.778E+12 | |||
| Germany | 3.997E+12 | |||
| Greece | 2.18E+11 | |||
| Hungary | 1.557E+11 | |||
| Ireland | 3.759E+11 | |||
| Italy | 2.074E+12 | |||
| Latvia | 3.485E+10 | |||
| Lithuania | 5.325E+10 | |||
| Luxembourg | 6.949E+10 | |||
| Malta | 1.454E+10 | |||
| Netherlands | 9.129E+11 | |||
| Poland | 5.858E+11 | |||
| Portugal | 2.38E+11 | |||
| Romania | 2.396E+11 | |||
| Slovakia | 1.065E+11 | |||
| Slovenia | 5.424E+10 | |||
| Spain | 1.426E+12 | |||
| Sweden | 5.51E+11 | |||
| United Kingdom | 2.825E+12 | |||
| 2017 | Honduras | 2.38E+10 |
| AUSTRALIA | 13 RTAs | |||
| YEAR | SIGNATORIES | GDP | GDP data yr (if not 2018) | Source |
| 1977 | Papua New Guinea | 2.34E+10 | ||
| 1983 | New Zealand | 2.05E+11 | ||
| 2003 | Singapore | 3.64E+11 | ||
| 2005 | Thailand | 5.05E+11 | ||
| 2005 | United States | 2.05E+13 | ||
| 2009 | Chile | 2.98E+11 | ||
| 2010 | Brunei | 1.36E+10 | ||
| Myanmar | 7.12E+10 | |||
| Cambodia | 2.46E+10 | |||
| Indonesia | 1.04E+12 | |||
| Laos | 1.81E+10 | |||
| Malaysia | 3.54E+11 | |||
| Philippines | 3.31E+11 | |||
| Vietnam | 2.45E+11 | |||
| 2014 | Rep of Korea | 1.62E+12 | ||
| 2015 | Japan | 4.97E+12 | ||
| 2015 | China | 1.36E+13 | ||
| 2018 | Canada | 1.71E+12 | ||
| Mexico | 1.22E+12 | |||
| Peru | 2.22E+11 | |||
| S KOREA | 18 RTAs | |||
| YEAR | SIGNATORIES | GDP | GDP data yr (if not 2018) | Source |
| 2004 | Chile | 2.98E+11 | ||
| 2006 | Iceland | 2.59E+10 | ||
| Liechtenstein | 6.21E+09 | YR2016 | tradingeconomics | |
| Norway | 4.35E+11 | |||
| Switzerland | 7.06E+11 | |||
| 2006 | Singapore | 3.64E+11 | ||
| 2010 | India | 2.73E+12 | ||
| 2010 | Brunei | 1.36E+10 | ||
| Myanmar | 7.12E+10 | |||
| Cambodia | 2.46E+10 | |||
| Indonesia | 1.04E+12 | |||
| Laos | 1.81E+10 | |||
| Malaysia | 3.54E+11 | |||
| Philippines | 3.31E+11 | |||
| Vietnam | 2.45E+11 | |||
| Thailand | 5.05E+11 | |||
| 2011 | Peru | 2.22E+11 | ||
| 2011 | Austria | 4.56E+11 | ||
| Belgium | 5.32E+11 | |||
| Bulgaria | 6.51E+10 | |||
| Croatia | 6.08E+10 | |||
| Cyprus | 2.45E+10 | |||
| Czech Republic | 2.44E+11 | |||
| Denmark | 3.51E+11 | |||
| Estonia | 3.03E+10 | |||
| Finland | 2.76E+11 | |||
| France | 2.78E+12 | |||
| Germany | 4E+12 | |||
| Greece | 2.18E+11 | |||
| Hungary | 1.56E+11 | |||
| Ireland | 3.76E+11 | |||
| Italy | 2.07E+12 | |||
| Latvia | 3.48E+10 | |||
| Lithuania | 5.33E+10 | |||
| Luxembourg | 6.95E+10 | |||
| Malta | 1.45E+10 | |||
| Netherlands | 9.13E+11 | |||
| Poland | 5.86E+11 | |||
| Portugal | 2.38E+11 | |||
| Romania | 2.4E+11 | |||
| Slovakia | 1.06E+11 | |||
| Slovenia | 5.42E+10 | |||
| Spain | 1.43E+12 | |||
| Sweden | 5.51E+11 | |||
| United Kingdom | 2.83E+12 | |||
| 2012 | United States | 2.05E+13 | ||
| 2013 | Turkey | 7.67E+11 | ||
| 2014 | Australia | 1.43E+12 | ||
| 2015 | China | 1.36E+13 | ||
| 2015 | Canada | 1.71E+12 | ||
| 2015 | New Zealand | 2.05E+11 | ||
| 2016 | Colombia | 3.3E+11 |
| SINGAPORE | 24 RTAs | |||
| YEAR | SIGNATORIES | GDP | GDP data yr (if not 2018) | Source |
| 1993 | Brunei | 1.3567E+10 | ||
| Myanmar | 7.1215E+10 | |||
| Cambodia | 2.4572E+10 | |||
| Indonesia | 1.0422E+12 | |||
| Laos | 1.8131E+10 | |||
| Malaysia | 3.5435E+11 | |||
| Philippines | 3.31E+11 | |||
| Vietnam | 2.4495E+11 | |||
| Thailand | 5.0499E+11 | |||
| 2001 | New Zealand | 2.0502E+11 | ||
| 2002 | Japan | 4.9709E+12 | ||
| 2003 | Iceland | 2.5878E+10 | ||
| Liechtenstein | 6210000000 | YR2016 | tradingeconomics | |
| Norway | 4.3475E+11 | |||
| Switzerland | 7.055E+11 | |||
| 2003 | Australia | 1.4322E+12 | ||
| 2004 | United States | 2.0494E+13 | ||
| 2005 | China | 1.3608E+13 | ||
| 2005 | India | 2.7263E+12 | ||
| 2005 | Jordan | 4.2291E+10 | ||
| 2006 | Rep of Korea | 1.6194E+12 | ||
| 2006 | Panama | 6.5055E+10 | ||
| 2006 | Chile | 2.9823E+11 | ||
| 2009 | Peru | 2.2224E+11 | ||
| 2013 | Costa Rica | 6.0126E+10 | ||
| 2013 | Bahrain | 3.7746E+10 | ||
| Kuwait | 1.4168E+11 | |||
| Oman | 7.9295E+10 | |||
| Qatar | 1.9201E+11 | |||
| Saudi Arabia | 7.8248E+11 | |||
| UAE | 4.1418E+11 | |||
| 2014 | Chinese Taipei | 5.8939E+11 | YR2018 | tradingeconomics |
| 2017 | Turkey | 7.6651E+11 | ||
This post was originally published by the author on his personal blog: https://joelrwrites.wordpress.com/2019/09/26/the-eu-is-useless-at-negotiating-free-trade-agreements/